Correlation is a measure of how two different things change together.
Causality is the actual relationship between causes and effects.
If they change together very closely, they have a positive correlation
If one thing goes up while the other goes down then we have a negative correlation.
Here are three examples of correlations:
(a) As someone owns more properties (during the recession) increases, the amount of foreclosures increases.
(b) People with lower education have a higher unemployment rate, and people with higher educations have a lower rate.
(c) There is no relationship between one’s education, and whether or not one owns pets.
{ from Correlation, http://www.mathsisfun.com/data/correlation.html }

{ from http://resources.esri.com/help/9.3/arcgisdesktop/com/gp_toolref/spatial_statistics_toolbox/regression_analysis_basics.htm }

When two different things change like this, does that prove that they are related? Does it prove that one thing causes another? Nope, not at all.
Sure, sometimes when two things change together, there is a reason for it. The correlation has a real cause!
But other times they may appear to change together out of dumb blind like; this is called a coincidence.
Just because two things are correlated (change together) doesn’t mean there is causation (one thing causes the other.)
So how can we tell if it is a coincidence, or if one thing really does cause the other?
If one thing causes something else to happen, there must be a way this happens – a causal mechanism
If you can show a realistic causal mechanism, then maybe the correlation does mean that A causes B.

Do pirates cause global warming? Look at this graph.
As time goes by, what happens to the number of pirates in the world? It goes way down!
And what happens to the world’s average temperature? It goes up.
In fact, the temperature goes up just as the number of pirates goes down.
These numbers are correlated.
But does that imply causation? (Does the decreasing # of pirates cause the increasing temperature? No.)
One way we know this is that there is no causal mechanism:
whether or not one chooses to be a pirate doesn’t affect temperature.
So why are these two different things correlated? Random chance (a coincidence.)
Millions of different things correlate with each other, with no reason.
Always be careful when someone says that A causes B.
Does A really cause B? If so, they must be able to show you a reason why it would happen.
{ from http://www.venganza.org/ }

Does organic food cause autism? Look at this graph.
As time goes by, what happens to the amount of organic food grown, sold and eaten? It goes up. And what happens to the number of people diagnosed as having autism? It goes up also.
These numbers are correlated. But does that imply causation? No.
One way we know this is that there is no causal mechanism. If someone wanted to prove that organic food caused autism, they would have to show how this happens.

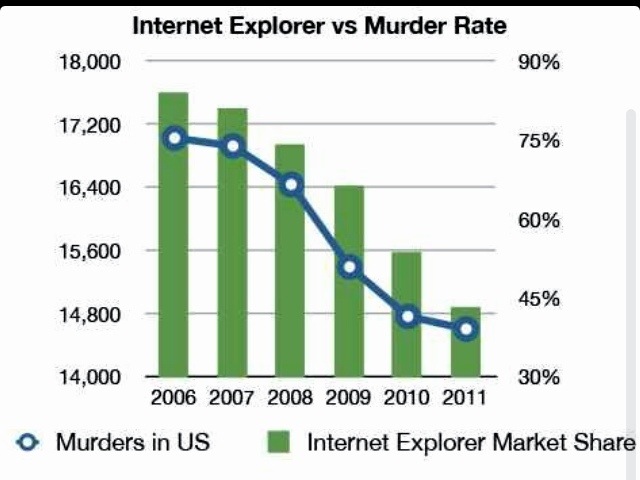
Does using Microsoft Internet Explorer as your web browser causer murder?
Obviously IE use rates are correlated with murder rates.
But is there causation? (Does using one kind of web browser really drive people to commit murder?) No.
Again, we see correlation without causation.
The correlation, again, is a coincidence.
Does the choice of words in a National Spelling Bee correlates with the number of people killed by venomous spiders?
Obviously these two different things are correlated.
But is there causation? (Do judges choosing words in spelling bees, somehow affect the number of venomous spiders? No.)
Again, we see correlation without causation.
The correlation, again, is a coincidence.

This image comes from the amazing website of Tyler Vigen. He created his website as a fun way to look at correlations and to think about data.
http://tylervigen.com/view_correlation?id=2941
So correlation doesn’t mean anything without causation
{ from http://fjhsalgebra1.blogspot.com/2013/11/correlation-vs-causation.html }

Many people assume that correlation equals causation, and that’s not only wrong, but dangerous.
It causes people make bad decisions, because they can get the chain of events wrong.
It also makes people expect that they will get some desired result, when really the result has nothing to do with the action.
Consider this fact: Many studies show that married people are more likely to be happy than unmarried people.
Does this mean that if you marry someone, that you will suddenly become a happy person?
Or is it exactly the other way around? Are happy people more likely to develop stable relationships and thus get married?
When can correlation equal causation?
Learning Standards
2016 Massachusetts Science and Technology/Engineering Curriculum Framework
Analyze data to identify relationships among seasonal patterns of change; use observations to describe patterns and/or relationships in the natural world and to answer scientific questions.
Science and engineering practices: Construct, analyze, and/or interpret graphical displays of data and/or large data sets to identify linear and nonlinear relationships.
• Use graphical displays (e.g., maps, charts, graphs, and/or tables) of large data sets to identify temporal and spatial relationships.
• Distinguish between causal and correlational relationships in data.
• Analyze and interpret data to provide evidence for phenomena.
Appendix VIII Value of Crosscutting Concepts and Nature of Science in Curricula
Cause and Effect: Mechanism and Explanation. Events have causes, sometimes simple, sometimes multifaceted. A major activity of science and engineering is investigating and explaining causal relationships and the mechanisms by which they are mediated. Such mechanisms can then be tested across given contexts and used to predict and explain events in new contexts or design solutions.
In grades 9–12, students can observe patterns in systems at different scales and cite patterns as empirical evidence for causality in supporting their explanations of phenomena. They recognize that classifications or explanations used at one scale may not be useful or need revision using a different scale, thus requiring improved investigations and experiments. They use mathematical representations to identify certain patterns and analyze patterns of performance in order to re-engineer and improve a designed system.
Grade 8. Statistics and Probability 8.SP
Investigate patterns of association in bivariate data.
1. Construct and interpret scatter plots for bivariate measurement data to investigate patterns of association between two quantities. Describe patterns such as clustering, outliers, positive or negative association, linear association, and nonlinear as
Interpreting Categorical and
Quantitative Data
• Summarize, represent, and interpret data on a single count or measurement variable.
• Summarize, represent, and interpret data on two categorical and quantitative variables.
• Interpret linear models.
Making Inferences and Justifying Conclusions
• Understand and evaluate random processes underlying statistical experiments.
• Make inferences and justify conclusions from sample surveys, experiments and observational studies.
Conditional Probability and the Rules of Probability
• Understand independence and conditional probability and use them to interpret data.
• Use the rules of probability to compute probabilities of compound events in a uniform probability model.
Using Probability to Make Decisions
• Calculate expected values and use them to solve problems.
• Use probability to evaluate outcomes of decisions.
STANDARDS FOR MATHEMATICAL PRACTICE
1. Make sense of problems and persevere in solving them.
2. Reason abstractly and quantitatively.
3. Construct viable arguments and critique the reasoning of others.
4. Model with mathematics.
5. Use appropriate tools strategically.
6. Attend to precision.
7. Look for and make use of structure.
8. Look for an express regularity in repeated reasoning.
Conditional Probability and the Rules of Probability S-CP
Understand independence and conditional probability and use them to interpret data.
Algebra I: Statistics and Probability
Interpreting Categorical and Quantitative
Data
• Summarize, represent, and interpret data on a single count or measurement variable.
• Summarize, represent, and interpret data on two categorical and quantitative variables.
• Interpret linear models.
Geometry: Statistics and Probability Conditional Probability and the Rules of Probability
• Understand independence and conditional probability and use them to interpret data.
• Use the rules of probability to compute probabilities of compound events in a uniform probability model.
Using Probability to Make Decisions
• Use probability to evaluate outcomes of decisions
Statistics and Probability
Conditional Probability and the Rules of Probability S-CP
Understand independence and conditional probability and use them to interpret data.
Algebra II: Statistics and Probability
Interpreting Categorical and Quantitative Data
• Summarize, represent and interpret data on a single count or measurement variable.
Making Inferences and Justifying Conclusions
• Understand and evaluate random processes underlying statistical experiments.
• Make inferences and justify conclusions from sample surveys, experiments and observational studies.
Using Probability to Make Decisions
• Use probability to evaluate outcomes of decisions.
