Home » Articles posted by New England Blogger (Page 36)
Author Archives: New England Blogger

Herd immunity
What is herd immunity?
It is a form of indirect protection from infectious disease
It occurs when a sufficient percentage of a population becomes immune to an infection, whether through vaccination or previous infections.
Immune individuals are unlikely to contribute to disease transmission. This slows or stops the spread of disease.
The greater the proportion of immune individuals in a community, the smaller the probability that other people will come into contact with an infectious individual.
Let’s see how this works, with a graphic from the National Institute of Allergy and Infectious Disease (NIAID.)
Top box
Shows an outbreak in a community in which a few people are infected (shown in red) and the rest are healthy but unimmunized (shown in blue); the illness spreads freely through the population.
Middle box
Shows a population where a small number have been immunized (shown in yellow); those not immunized become infected while those immunized do not.
Bottom box
A large proportion of the population have been immunized; this prevents the illness from spreading significantly, including to unimmunized people.
In the first example, most healthy unimmunized people become infected, whereas in the bottom example only one fourth of the healthy unimmunized people become infected.

The National Institute of Allergy and Infectious Disease (NIAID)
Herd immunity is not all or nothing
On her blog, Your Local Epidemiologist, Katelyn Jetelina brings up important points:
-
Is there some known, specific number we have to reach, in order to claim herd immunity?
-
Is mass vaccination useless in stopping the spread of a disease unless we reach this specific percent?
-
Does this specific number stay the same, or does it change over time?
-
How does our behavior affect herd immunity?
In her home city, health officials stated that their county had reached herd immunity against COVID-19. 80% of people in the county had either previously contracted COVID19 and/or had received at least one vaccination.
In response, Katelyn Jetelina writes
This is exciting. Maybe this means there’s light at the end of the long, pandemic tunnel… However, we cannot come to erroneous conclusions once we reach a magical number in our head or on a county dashboard.
***Herd immunity 101***
I think we all know by now that not 100% of our population has to be immune for COVID19 to wither away. We can get to a point where so few people have COVID19 that even those who can’t be protected (like the immunocompromised ) will never have the chance to get sick. An immunity wall will keep any outbreak or transmission from happening.
On a global stage, we’ve only hit herd immunity once. In 1980, the World Health Assembly declared that smallpox was eradicated thanks to a very successful global vaccination campaign. No cases of naturally occurring smallpox have happened since.
In 2000, the CDC also declared that measles was eradicated in the United States as we reached herd immunity. This was a huge achievement given that the measles is incredibly contagious; we needed ~95% herd immunity threshold. Unfortunately, this is not still the case. Because of the antivaxx movement, we continue to dip below the threshold of protection and outbreaks happen all the time. The 2019 measles outbreak at Disneyland is just one example.
***Herd immunity threshold is really complex to measure.***
We don’t even know what the magic number is for COVID19. In the beginning, scientists estimated a 69.6% threshold was needed to reach herd immunity in the United States. This was based on a lot of mathematical models and educated guesses. Importantly, this guess relied heavily on R(0).
But the pandemic is not a fixed. It continuously evolves. Which means this threshold continues to move. The more transmissible the variant (like Delta) the higher the threshold we need.
Our behaviors also impact the threshold. Not wearing masks, not social distancing, etc. will also move our threshold higher. Population density, genetics, environment, and a whole lot of other things can also impact this number.
Thus, herd immunity in the United States can be very different than what is needed in Canada. Because of this, it’s really difficult (in fact I would argue impossible) to forecast an accurate number.
***Even if we knew the number, it’s not a light switch.***
It’s not a finish line. Not a binary decision. Not a static goal post that, once we reach, this nightmare will end and everyone’s risk for COVID19 will be zero.
My friend and colleague, Dr. Malia Jones, explained what it might look like instead:
“(A) receding tide. As more and more people are vaccinated, those who are at highest risk for ending up in the ICU will be protected. We’ll all have growing protection from outbreaks as people who are high transmitters get vaccinated. (Looking right at you, young adults.) Cases will start to ebb overall, but we can expect some ups and downs. There will be more variants, and there will be more surges. We’ll have low enough transmission that we will be able to resume most normal activities.”
***And herd immunity is not a city, county, or even state level metric.***
The 80% threshold that Dallas reached is a pooled estimate. There are still significant pockets within Dallas that remain extremely vulnerable. Even though Dallas reached “herd immunity”, cases continue to rise in Dallas.
But even if there weren’t pockets within, viruses don’t see city lines. We live in a very transient and fluid society. We move between counties, states, and countries.
And it’s dangerous to think that viruses see lines. There’s a very real possibility that people will think they’re protected if we reach a magic number. They may wrongly think this is over, that vaccines aren’t important anymore, and that we can put our guard down. This is a dangerous game to play.
***We may not reach herd immunity. But it isn’t all for nothing.***
We don’t need to reach herd immunity for a pandemic to end; for us to reach some sort of pre-pandemic normality. Herd immunity is not a number we need for cases to all of a sudden plummet. Instead it’s a number we need in order to keep cases down AFTER they are already down. Like Dr. Jones says, it’s a policy goal.
During a Stanford panel, a number of experts agreed that the next phase will be an endemic: “a plateau in infection, with a decrease in prominence over time but continued circulation.” This will be a mild state in which we don’t have exponential swings but, instead, people will get sick on occasion.
***Bottom Line***
There is not going to be a “herd immunity day” where life immediately goes back to normal. We need to start thinking of it as a receding tide rather than a light switch. Yes, we should celebrate vaccine progression. And yes, some are still hopeful that we will eventually reach herd immunity. But it will be slow. It will be quiet. And we will only know we reached it until it’s passed.
About the author: Katelyn Jetelina has a Masters in Public Health and PhD in Epidemiology and Biostatistics. She is an Assistant Professor at a School of Public Health where her research lab resides.
Related articles
Vaccines
The History of Vaccines: Interactive animations
.
pH and Equilibrium
from “An Introduction to Chemistry by Mark Bishop”
http://preparatorychemistry.com/Bishop_pH_Equilibrium.htm
According to the Arrhenius theory of acids and bases, when an acid is added to water, it donates an H+ ion to water to form H3O+ (often represented by H+).
The higher the concentration of H3O+ (or H+) in a solution, the more acidic the solution is.
An Arrhenius base is a substance that generates hydroxide ions, OH–, in water. The higher the concentration of OH– in a solution, the more basic the solution is.
Pure water undergoes a reversible reaction in which both H+ and OH– are generated.
H2O(l) H+(aq) + OH–(aq)
The equilibrium constant for this reaction, called the water dissociation constant, Kw, is 1.01 × 10⁻¹⁴ at 25 °C.
Kw = [H+][OH–] = 1.01 × 10⁻¹⁴ at 25 °C
Because every H+ (H3O+) ion that forms is accompanied by the formation of an OH– ion, the concentrations of these ions in pure water are the same and can be calculated from Kw.
Kw = [H+][OH–] = (x)(x) = 1.01 × 10⁻¹⁴
x = [H+] = [OH-] = 1.01 × 10⁻⁷ M
(1.005 × 10⁻⁷ M before rounding)
The equilibrium constant expression shows that the concentrations of H+ and OH– in water are linked. As one increases, the other must decrease to keep the product of the concentrations equal to 1.01 × 10⁻¹⁴ (at 25 °C).
If an acid, like hydrochloric acid, is added to water, the concentration of the H+ goes up, and the concentration of the OH– goes down, but the product of those concentrations remains the same.
An acidic solution can be defined as a solution in which the [H+] > [OH–].
The example below illustrates this relationship between the concentrations of H+ and OH– in an acidic solution.
EXAMPLE 1 – Determining the Molarity of Acids and Bases in Aqueous Solution: Determine the molarities of H+ and OH– in a 0.025 M HCl solution at 25 °C.
Solution:
Kw = [H+][OH–] = 1.01 × 10⁻¹⁴ at 25 °C
We assume that hydrochloric acid, HCl(aq), like all strong acids, is completely ionized in water. Thus the concentration of H+ is equal to the HCl concentration.
[H+] = 0.025 M H+
We can calculate the concentration of OH– by rearranging the water dissociation constant expression to solve for [OH–] and plugging in 1.01 × 10⁻¹⁴ for Kw and 0.025 for [H+].
Note that the [OH–] is not zero, even in a dilute acid solution.
If a base, such as sodium hydroxide, is added to water, the concentration of hydroxide goes up, and the concentration of hydronium ion goes down. A basic solution can be defined as a solution in which the [OH–] > [H+].
EXAMPLE 2 – Determining the Molarity of Acids and Bases in Aqueous Solution: Determine the molarities of H+ and OH– in a 2.9 × 10⁻³ M NaOH solution at 30 °C.
Solution:
Kw = [H+][OH–] = 1.47 × 10⁻¹⁴ at 30 °C (From Table)
Sodium hydroxide is a water-soluble ionic compound and a strong electrolyte, so we assume that it is completely ionized in water, making the concentration of OH- equal to the NaOH concentration.
[OH–] = 2.9 × 10⁻³ M OH–
Note that the [H+] is not zero even in a dilute solution of base.
Typical solutions of dilute acid or base have concentrations of H+ and OH– between 10-14 M and 1 M. The table below shows the relationship between the H+ and OH– concentrations in this range.
Concentrations of H+ and OH– in Dilute Acid and Base Solutions at 25 °C
| [H+] | [OH–] |
| 1.0 M | 1.0 × 10⁻¹⁴ M |
| 1.0 × 10⁻³ M | 1.0 × 10⁻¹¹ M |
| 1.0 × 10⁻⁷ M | 1.0 × 10⁻⁷ M |
| 1.0 × 10⁻¹⁰ M | 1.0 × 10⁻⁴ M |
| 1.0 × 10⁻¹⁴ M | 1.0 M |
We could describe the relative strengths of dilute solutions of acids and bases by listing the molarity of H+ for acidic solutions and the molarity of OH– for basic solutions. There are two reasons why we use the pH scale instead.
The first reason is that instead of describing acidic solutions with [H+] and basic solutions with [OH–], chemists prefer to have one scale for describing both acidic and basic solutions. Because the product of the H+ and OH– concentrations in such solutions is always 1.01 × 10⁻¹⁴ at 25 °C, when we give the concentration of H+, we are indirectly also giving the concentration of OH–.
For example, when we say that the concentration of H+ in an acidic solution at 25 °C is 10-3 M, we are indirectly saying that the concentration of OH– in this same solution is 10-11 M.
When we say that the concentration of H+ in a basic solution at 25 °C is 10-10 M, we are indirectly saying that the OH– concentration is 10-4 M.
The pH concept makes use of this relationship to describe both dilute acid and dilute base solutions on a single scale.
The next reason for using the pH scale instead of H+ and OH– concentrations is that in dilute solutions, the concentration of H+ is small, leading to the inconvenience of measurements with many decimal places, such as 0.000001 M H+, or to the potential confusion associated with scientific notation, as with 1 × 10⁻⁶ M H+.
In order to avoid such inconvenience and possible confusion, pH is defined as the negative logarithm of the H+ concentration.
pH = -log[H+]
Instead of saying that a solution is 0.0000010 M H+ (or 1.0 × 10⁻⁶ M H+) and 0.000000010 M OH– (or 1.0 × 10⁻⁸ M OH–), we can indirectly convey the same information by saying that the pH is 6.00.
pH = -log[H+] = -log(1.0 × 10⁻⁶) = 6.00
When taking the logarithm of a number, report the same number of decimal positions in the answer as you had significant figures in the original value.
Because 1.0 × 10⁻⁶ has two significant figures, we report 6.00 as the pH for a solution with 1.0 × 10⁻⁶ M H+.
The table below shows a range of pH values for dilute solutions of acid and base.
pH of Dilute Solutions of Acids and Bases at 25 °C
| [H+] | [OH-] | pH |
| 1.0 | 1.0 × 10⁻¹⁴ | 0.00 |
| 1.0 × 10⁻¹ | 1.0 × 10⁻¹³ | 1.00 |
| 1.0 × 10⁻² | 1.0 × 10⁻¹² | 2.00 |
| 1.0 × 10⁻³ | 1.0 × 10⁻¹¹ | 3.00 |
| 1.0 × 10⁻⁴ | 1.0 × 10⁻¹⁰ | 4.00 |
| 1.0 × 10⁻⁵ | 1.0 × 10⁻⁹ | 5.00 |
| 1.0 × 10⁻⁶ | 1.0 × 10⁻⁸ | 6.00 |
| 1.0 × 10⁻⁷ | 1.0 × 10⁻⁷ | 7.00 |
| 1.0 × 10⁻⁸ | 1.0 × 10⁻⁶ | 8.00 |
| 1.0 × 10⁻⁹ | 1.0 × 10⁻⁵ | 9.00 |
| 1.0 × 10⁻¹⁰ | 1.0 × 10⁻⁴ | 10.00 |
| 1.0 × 10⁻¹¹ | 1.0 × 10⁻³ | 11.00 |
| 1.0 × 10⁻¹² | 1.0 × 10⁻² | 12.00 |
| 1.0 × 10⁻¹³ | 1.0 × 10⁻¹ | 13.00 |
| 1.0 × 10⁻¹⁴ | 1.0 | 14.00 |
This table illustrates several important points about pH. Notice that
- When the solution is acidic ([H+] > [OH–), the pH is less than 7.
- When the solution is basic ([OH–] > [H+]), the pH is greater than 7.
- When the solution is neutral ([H+] = [OH–]), the pH is 7. (Solutions with pH’s between 6 and 8 are often considered essentially neutral.)
Also notice that
- As a solution gets more acidic (as [H+] increases), the pH decreases.
- As a solution gets more basic (higher [OH–]), the pH increases.
- As the pH of a solution decreases by one pH unit, the concentration of H+ increases by ten times.
- As the pH of a solution increases by one pH unit, the concentration of OH– increases by ten times.
- The pH, [H+], and [OH–] of some common solutions are listed in the figure below. Notice that gastric juice in our stomach has a pH of about 1.4, and orange juice has a pH of about 2.8. Thus, gastric juice is more than ten times more concentrated in H+ than orange juice.
The pH difference of about 4 between household ammonia solutions (pH about 11.9) and milk (pH about 6.9) shows that household ammonia has about ten thousand (104) times the hydroxide concentration of milk.
pH of Common Substances Acidic solutions have pH values less than 7, and basic solutions have pH values greater than 7. The more acidic the solution is, the lower its pH. The more basic a solution is, the higher the pH.
The corresponding H+ and OH– concentrations are shown in units of molarity. Notice that a decrease of one pH unit corresponds to a ten-fold increase in [H+], and an increase of one pH unit for a basic solution corresponds to a ten-fold increase in [OH–].
EXAMPLE 3 – pH Calculations: In Example 1, we found that the H+ concentration of a 0.025 M HCl solution was 0.025 M H+. What is its pH?
Solution:
pH = -log[H+] = -log(0.025) = 1.60
EXAMPLE 4 – pH Calculations: In Example 2, we found that the H+ concentration of a 2.9 × 10⁻³ NaOH solution was 5.1 × 10⁻¹² M H+. What is its pH?
Solution:
pH = -log[H+] = -log(7.5 × 10⁻¹²) = 11.29
We can convert from pH to [H+] and [OH–] using the following equations, as demonstrated in Examples 5 and 6.
[H+] = 10-pH
EXAMPLE 5 – pH Calculations: What is the [H+] in a glass of lemon juice with a pH of 2.12?
Solution:
[H+] = 10-pH = 10-2.12 = 7.6 × 10⁻³ M H+
EXAMPLE 6 – pH Calculations: What is the [OH–] in a container of household ammonia at 25 °C with a pH of 11.900?
Solution:
[H+] = 10-pH = 10-11.900 = 1.26 × 10⁻¹² M H+
Learning Standards
2016 Massachusetts Science and Technology/Engineering Curriculum Framework
HS-PS1-9 (MA). Relate the strength of an aqueous acidic or basic solution to the extent of an acid or base reacting with water, as measured by the hydronium ion concentration (pH) of the solution. Make arguments about the relative strengths of two acids or bases with similar structure and composition.
Science and Engineering Practices
Mathematical and computational thinking in 9–12 builds on pre-K–8 and experiences and progresses to using algebraic thinking and analysis, a range of linear and nonlinear functions including trigonometric functions, exponentials and logarithms, and computational tools for statistical analysis to analyze, represent, and model data.
Benchmarks for Science Literacy, AAAS
Most cells function best within a narrow range of temperature and acidity. At very low temperatures, reaction rates are too slow. High temperatures and/or extremes of acidity can irreversibly change the structure of most protein molecules. Even small changes in acidity can alter the molecules and how they interact. 5C/H7
The temperature and acidity of a solution influence reaction rates. Many substances dissolve in water, which may greatly facilitate reactions between them. 4D/M4
ACS Middle School Chemistry Lessons
From middleschoolchemistry.com, contact staff at ACS. Copyright 2015 American Chemical Society
Online textbook: Chapter 5: Acids Bases and their reactions
http://www.chem4kids.com/files/react_acidbase.html
http://www.chemistryland.com/CHM151S/04-Solutions/acids/AcidsBases151.html
Action potentials
Andy Maldonado, on Quora, writes
An action potential is the way by which neurons communicate.
Neurons are negatively charged on the inside and positively charged on the outside.
This is due to the different concentrations of Na+, K+, Cl-, Ca2+, and charged proteins distributed both in and outside the neuron.
An action potential begins when a disruption of this distribution causes Na+ to flow into the neuron, through Na+ channels, causing the inside to become more positive.
The more positively charged inside of the neuron triggers adjacent voltage-gated Na+ channels to open and allow more ions to flow through.
The increase in charge inside the neuron triggers K+ channels to open – allowing for ions to flow outside of the cell, and thus lowering the inside charge back to its original state.
This increase and decrease in charge causes a wave-like motion of ions that propagates down the axon of a neuron – and ultimately causes the release of neurotransmitters from the dendrites – which stimulate the next neuron to either initiate or inhibit an action potential.
Action potentials trigger neuronal pathways which can stimulate or inhibit certain functions in our body. For example, action potentials in the motor region of the brain may stimulate a neural pathway with leads to the muscles in your arms resulting in flexion. Action potentials also facilitate communication between neuronal networks in the brain which allow us to have conscious thoughts, emotions, and memories.
Animation

By Laurentaylorj, on Wikimedia
As a nerve impulse travels down the axon, there is a change in polarity across the membrane.
The Na+ and K+ gated ion channels open and close in response to a signal from another neuron. At the beginning of action potential, the Na+ gates open and Na+ moves into the axon. This is depolarization. Repolarization occurs when the K+ gates open and K+ moves outside the axon. This creates a change in polarity between the outside of the cell and the inside. The impulse continuously travels down the axon in one direction only, through the axon terminal and to other neurons.
External links
http://blog.eyewire.org/the-nervous-system-action-potential-crash-course-2/
Learning Standards
2016 Massachusetts Science and Technology/Engineering Curriculum Framework
HS-LS1-2. Develop and use a model to illustrate the key functions of animal body systems: Emphasis is on the primary function of the following body systems… nervous (neurons, brain, spinal cord).
College Board Science Standards
LSH-PE.5.5.4 Construct a simple representation of a feedback mechanism that maintains the internal conditions of a living system within certain limits as the external conditions change.
LSH-PE.5.5.5 Construct a representation of the interaction of the endocrine and nervous systems (e.g., hormones and electrochemical impulses) as they interact with other body systems to respond to a change in the environment (e.g., touching a hot stove). Explain how the representation is like and unlike the phenomenon it is representing.
How records work
How record work (private for now)
https://kaiserscience.wordpress.com/physics/waves/how-records-work/

Lack of exercise is a major cause of chronic diseases
Lack of exercise is a major cause of chronic diseases

U.S. Air Force photo by Staff Sgt. Christopher Hubenthal
Chronic diseases are major killers in the modern era. Physical inactivity is a primary cause of most chronic diseases.
The initial third of the article considers: activity and prevention definitions; historical evidence showing physical inactivity is detrimental to health and normal organ functional capacities; cause vs. treatment; physical activity and inactivity mechanisms differ; gene-environment interaction [including aerobic training adaptations, personalized medicine, and co-twin physical activity]; and specificity of adaptations to type of training.
Next, physical activity/exercise is examined as primary prevention against 35 chronic conditions
[Accelerated biological aging/premature death, low cardiorespiratory fitness (VO2 max), sarcopenia, metabolic syndrome, obesity, insulin resistance, prediabetes, type 2 diabetes, non-alcoholic fatty liver disease, coronary heart disease, peripheral artery disease, hypertension, stroke, congestive heart failure, endothelial dysfunction, arterial dyslipidemia, hemostasis,
deep vein thrombosis, cognitive dysfunction, depression and anxiety, osteoporosis, osteoarthritis, balance, bone fracture/falls, rheumatoid arthritis, colon cancer, breast cancer, endometrial cancer, gestational diabetes, preeclampsia, polycystic ovary syndrome, erectile dysfunction, pain, diverticulitis, constipation, and gallbladder diseases].
The article ends with consideration of deterioration of risk factors in longer-term sedentary groups; clinical consequences of inactive childhood/adolescence; and public policy. In summary, the body rapidly maladapts to insufficient physical activity, and if continued, results in substantial decreases in both total and quality years of life. Taken together, conclusive evidence exists that physical inactivity is one important cause of most chronic diseases. In addition, physical activity primarily prevents, or delays, chronic diseases, implying that chronic disease need not be an inevitable outcome during life.
Source
Lack of exercise is a major cause of chronic diseases
Frank W. Booth, Ph.D., Christian K. Roberts, Ph.D., and Matthew J. Laye, Ph.D.
PMC 2014 Nov 23, and Comprehensive Physiology 2012 Apr; 2(2): 1143–1211.5
https://www.ncbi.nlm.nih.gov/pmc/articles/PMC4241367/
https://onlinelibrary.wiley.com/doi/abs/10.1002/cphy.c110025
Detecting genetic disorders with 3d face scans
It is possible to detect numerous types pf genetic disorders with 3d face scans
How do we make measurements of the face?

How can we automate such measurements and make them accurate?

(Facial recognition technology will change the way we live, The Economist)
Detecting genetic disorders with 3d face scans
Johan at the Phineas Gage Fan Club writes:
Following on from last week’s post on smile measuring software, The Scotsman (via Gizmodo) reports on the work by Hammond and colleagues at UCL, who are developing 3d face scans as a quick, inexpensive alternative to genetic testing.
This is not as crazy as it sounds at first since it is known that in a number of congenital conditions, the hallmark behavioural, physiological or cognitive deficits are also (conveniently) accompanied by characteristic appearances.
The classic example of this is Down syndrome, which you need no software to recognise. More examples appear in the figure above, where you can compare the characteristic appearances of various conditions to the unaffected face in the middle.
Hammond’s software can be used to identify 30 congenital conditions, ranging from Williams syndrome (a sure topic of a future post) to Autism,
Detecting genetic disorders with 3d face scans


========================================
Diagnostically relevant facial gestalt information from ordinary photos
Rare genetic disorders affect around 8% of people, many of whom live with symptoms that greatly reduce their quality of life. Genetic diagnoses can provide doctors with information that cannot be obtained by assessing clinical symptoms, and this allows them to select more suitable treatments for patients. However, only a minority of patients currently receive a genetic diagnosis.
Alterations in the face and skull are present in 30–40% of genetic disorders, and these alterations can help doctors to identify certain disorders, such as Down’s syndrome or Fragile X.
Extending this approach, Ferry et al. trained a computer-based model to identify the patterns of facial abnormalities associated with different genetic disorders. The model compares data extracted from a photograph of the patient’s face with data on the facial characteristics of 91 disorders, and then provides a list of the most likely diagnoses for that individual. The model used 36 points to describe the space, including 7 for the jaw, 6 for the mouth, 7 for the nose, 8 for the eyes and 8 for the brow.
This approach of Ferry et al. has three advantages. First, it provides clinicians with information that can aid their diagnosis of a rare genetic disorder. Second, it can narrow down the range of possible disorders for patients who have the same ultra-rare disorder, even if that disorder is currently unknown. Third, it can identify groups of patients who can have their genomes sequenced in order to identify the genetic variants that are associated with specific disorders.
from Quentin Ferry et al, eLife 2014;3:e02020
========================================
This App Uses Facial Recognition Software to Help Identify Genetic Conditions
A geneticist uploads a photo of a patient’s face, and Face2Gene gathers data and generates a list of possible syndromes
… Face2Gene, the tool Abdul-Rahman used, was created by the Boston startup, FDNA. The company uses facial recognition software to aid clinical diagnoses of thousands of genetic conditions, such as Sotos syndrome (cerebral gigantism), Kabuki syndrome (a complicated disorder that features developmental delay, intellectual disability and more) and Down syndrome.
This App Uses Facial Recognition Software to Help Identify Genetic Conditions, Smithsonian Magazine
Related resources
How phenotypes lead to genotypes (infographic?)
Scientific journal articles
Detecting Genetic Association of Common Human Facial Morphological Variation Using High Density 3D Image Registration, Shouneng Peng et al, PLoS Comput Biol. 2013 Dec; 9(12)
Digesting nutrients
This next section comes from BBC KS3 Bitzesize Science, http://www.bbc.co.uk, Organisms, behaviour and health
Enzymes
Special proteins that can break large molecules into small molecules.
Different types of enzymes can break down different nutrients:
-
carbohydrase or amylase ⇒ break down starch into sugar
-
protease ⇒ break down proteins into amino acids
-
lipase ⇒ break down fats into fatty acids and glycerol
Carbohydrates
Saliva in your mouth contains amylase, which is a starch digesting enzyme.

Proteins
Proteins are digested in the stomach and small intestine.
Protease enzymes break down proteins into amino acids.
Digestion of proteins in the stomach is helped by stomach acid, which is strong hydrochloric acid. This also kills harmful micro-organisms that may be in the food.

Fats
Lipase enzymes break down fat into fatty acids and glycerol. Digestion of fat in the small intestine is helped by bile, made in the liver. Bile breaks the fat into small droplets that are easier for the lipase enzymes to work on.

Things that are not digested
Minerals, vitamins and water are already small enough to be absorbed by the body without being broken down
Fiber – these are carbohydrates that our body can’t digest
Breaking proteins and fats down into smaller parts
How does the digestive system break larger molecules down into smaller molecules?
Hydrolysis – adding an H2O molecule can break bonds apart.
Here we see hydrolysis breaking a tiny protein down into two separate amino acids.
(And then, the animation shows how the opposite can occur when needed: How two separate amino acids can be condensed together by removing an OH from one of them, and and H from the other, creating a new H2O molecule left over.)

Similarly, here we see hydrolysis breaking a fat (triglyceride) down into smaller pieces (glycerol and 3 fatty acids.)
(And then, the animation shows how the opposite can occur when needed: How they all can be condensed together by removing an OH from one of them, and and H from the other, creating a new H2O molecule left over.)

How does does starch enter the bloodstream

Absorption and egestion
http://www.bbc.co.uk/bitesize/ks3/science/organisms_behaviour_health/diet_drugs/revision/6/
These are the processes that happen in the digestive system:
ingestion (eating) → digestion (breaking down) → absorption → egestion
Digested food molecules are absorbed in the small intestine. This means that they pass through the wall of the small intestine and into ourbloodstream.
Once in the bloodstream, the digested food molecules are carried around the body to where they are needed.
Only small, soluble substances can pass across the wall of the small intestine.
Large insoluble substances cannot pass through.


The inside wall of the small intestine needs to be thin, with a really big surface area.
This allows absorption to happen quickly and efficiently. If the small intestine had a thick wall and a small surface area, a lot of digested food might pass out of the body before it had a chance to be absorbed.
To get a big surface area, the inside wall of the small intestine is lined with tiny villi (one of them is called a villus).
These stick out and give a big surface area. They also contain blood capillaries to carry away the absorbed food molecules.

Stone walls
Walk into a patch of forest in New England, and chances are you will—almost literally—stumble across a stone wall. According to Robert Thorson, a landscape geologist at University of Connecticut, these walls are “damn near everywhere” in the forests of rural New England.

Carlisle stone wall Massachusetts at 42° 30′ 21.79″ N, 71° 21′ 15.83″ from Wikimedia
Jeanna Bryner, in Livescience, writes about the rediscovery of the lost archaeological landscape of New England.
Leaf-off (left) and Leaf-on (right) aerial photographs with a modern road superimposed through the northeast corner of the image for reference .

These stone walls and other archaeological features could not be seen with traditional aerial photographs shown here. This figure illustrates the advantage of LiDAR data with a point spacing of 1 meter or better over traditional map views of the landscape for archaeological purposes.
Examinations of airborne scans, using light detection and ranging (LiDAR), of three New England towns have revealed networks of old stone walls, building foundations, old roads, dams and other features, many of which long were forgotten. Here, stone walls are yellow, abandoned roads are red, and building foundations are outlined by green squares.

LiDAR is not only a powerful tool on its own; it can also be used in conjunction with the many types of historical documents available to those performing research in this geographic area,” Johnson and Ouimet write in the Journal of Archaeological Science.
As an example, this 1934 aerial photograph taken of an area in Preston, Conn., shows a farmstead — cleared fields, forest, stone walls or fences, a house, a barn and other outbuildings, and a road running through the farm.

Now compare with this aerial image from 2012.

from Livescience, Images: ‘Lost’ New England Archaeology Sites Revealed in LiDAR Photos, 1/16/14
==================
New England Is Crisscrossed With Thousands of Miles of Stone Walls
That’s enough to circle the globe—four times.
By Anna Kusmer 5/4/18
Walk into a patch of forest in New England, and chances are you will—almost literally—stumble across a stone wall. Thigh-high, perhaps, it is cobbled together with stones of various shapes and sizes, with splotches of lichen and spongy moss instead of mortar. Most of the stones are what are called “two-handers”—light enough to lift, but not with just one hand. The wall winds down a hill and out of sight. According to Robert Thorson, a landscape geologist at University of Connecticut, these walls are “damn near everywhere” in the forests of rural New England.
He estimates that there are more than 100,000 miles of old, disused stone walls out there, or enough to circle the globe four times.
Who would build a stone wall, let alone hundreds of thousands of miles of them, in the middle of the forest? No one. The walls weren’t built in the forest but in and around farms. By the middle of the 19th century, New England was over 70 percent deforested by settlers, a rolling landscape of smallholdings as far as the eye could see. But by the end of the century, industrialization and large-scale farms led to thousands of fields being abandoned, to begin a slow process of reforestation.
“New England had great pastures,” says Thorson. “It was a beef-butter-bacon economy.”
As farmers cleared those New England forests, they found rocks—lots and lots of them. The glaciers that receded at the end of the last Ice Age left behind millions of tons of stone in a range of sizes. New England soils remain notoriously stony today.
When life gives you stones? Build a wall. Farmers pulled these plow-impeding stones from their fields and piled them on the edges. “The farmer’s main interest was his fields,” says Thorson. “The walls are simply a disposal pile. It was routine farm work.” This process was replicated at thousands of farms across the region—a collective act of labor on a glacial scale.
The supply of stone seemed endless. A field would be cleared in the autumn, and there would be a whole new crop of stones in the spring. This is due to a process known as “frost heave.” As deforested soils freeze and thaw, stones shift and migrate to the surface. “People in the Northeast thought that the devil had put them there,” says Susan Allport, author of the book Sermons in Stone: The Stone Walls of New England and New York. “They just kept coming.”
Wall-building peaked in the mid-1800s when, Thorson estimates, there were around 240,000 miles of them in New England. That amounts to roughly 400 million tons of stone, or enough to build the Great Pyramid of Giza—more than 60 times over.
No one dedicates more time to thinking about these walls than Thorson, who has written a children’s book, a field guide, and countless articles about them since he first moved to New England in 1984. Thorson, bald and bearded, a mossy stone himself, is a landscape geologist, and he distinctly remembers his first walks in the New England woods—and coming across one stone wall after another. His mind was full of questions about what they were and who built them, “it was a phenomenon that was extraordinary,” he says. “One thing led to another, and I got obsessed on the topic”.
Thorson started the Stone Wall Initiative in 2002, aimed at educating the public about this distinctive feature of their forests, in addition to conserving the walls and studying how they impact the landscape around them. Thorson has built a reputation as the ultimate expert on this phenomenon. “You know how a natural history museum would have a person who identifies stuff for you? I’m kind of that guy for stone walls,” he says.
Every year he takes his students to a maple-beech forest stand in Storrs, Connecticut, which he calls “The Glen,” to look at a classic farmstead stone wall. This wall is thigh-high, and mostly built of gneiss and schist, metamorphic rocks common in the valley flanks of central New England. With Thorson’s help, one begins to see a little structure in how the stones were stacked—in messy tiers, by a farmer who added one load at a time.
Thorson may be particularly obsessed with the walls, but he’s not alone in the interest. He is constantly invited to speak at garden clubs, historical societies, public libraries, and more. “The interest doesn’t die down,” he says. “Twenty years later, it’s still going on.”
His field guide, Exploring Stone Walls, is a directory of some of the most unusual, interesting, or distinctive walls in the region. The tallest example is a mortared sea wall beneath the Cliff Walk in Newport, Rhode Island, measuring over 100 feet. The oldest wall, in Popham Point, Maine, dates to 1607. Thorson’s favorite historically significant wall is at the Old Manse, a historic home in Concord, Massachusetts. It provided cover for minutemen firing on the British during the Revolutionary War. Thorson also highlights Robert Frost’s “Mending Wall,” located on his farm in Derry, New Hampshire, the inspiration for the famous line, “Good fences make good neighbors.”
Thorson knows about as much as one can know about the world-wonder- scale web of walls across the Northeast, but there remains much to learn, particularly in terms of what they mean for ecosystems, such as their role as both habitat and impediment to wildlife, and their effect on erosion and sedimentation. “It sounds silly,” he says, “but we almost know nothing about them.”
Geographer and landscape archaeologist Katharine Johnson earned her doctorate mapping stone walls from above, using lidar (light detection and ranging) technology. Lidar is similar to radar, only instead of using radio waves to detect objects, it uses light. Laser pulses—thousands per second—are emitted from a specially equipped plane. There are so many of these pulses, that some are able to hit the small spaces between leaves and penetrate all the way to the forest floor, even through thick tree cover. Johnson’s lidar images reveal the exent of those crisscrossing stone walls in a way nothing else can.
Her research shows that, stripped of the region’s resurgent forests, the walls provide a snapshot of 19th-century history—a map of what land was cleared and farmed at the time. Combined with other data on the forests themselves, this can help specialists model historic forest cover and, in turn, help ecologists understand how forests grow back after they have been disturbed or cleared entirely. The walls can hold the key to New England’s social history, including settlement patterns and farming styles. They provide a static backdrop against which change can be measured.
“Stone walls are the most important artifacts in rural New England,” Thorson says. “They’re a visceral connection to the past. They are just as surely a remnant of a former civilization as a ruin in the Amazon rain forest.”
Each of the millions of stones that make up New England stone walls was held by a person, usually a subsistence farmer, or perhaps a hired Native American or a slave. What remains is a trace of countless individual acts etched on the landscape. “Those labors,” says Allport, “hundreds of years later, they endure.”
source atlasobscura.com/articles/new-england-stone-walls
Related references
https://www.livescience.com/42638-lost-new-england-archaeology-lidar-photos.html
https://news.nationalgeographic.com/news/2014/01/140103-new-england-archaeology-lidar-science/
Scientific articles
Rediscovering the lost archaeological landscape of southern New England using airborne light detection and ranging (LiDAR), Katharine M.Johnson and William B.Ouimet, Journal of Archaeological Science, Volume 43, March 2014, Pages 9-20
This website is educational. Materials within it are being used in accord with the Fair Use doctrine, as defined by United States law.
§107. Limitations on Exclusive Rights: Fair Use. Notwithstanding the provisions of section 106, the fair use of a copyrighted work, including such use by reproduction in copies or phone records or by any other means specified by that section, for purposes such as criticism, comment, news reporting, teaching (including multiple copies for classroom use), scholarship, or research, is not an infringement of copyright. In determining whether the use made of a work in any particular case is a fair use, the factors to be considered shall include: the purpose and character of the use, including whether such use is of a commercial nature or is for nonprofit educational purposes; the nature of the copyrighted work; the amount and substantiality of the portion used in relation to the copyrighted work as a whole; and the effect of the use upon the potential market for or value of the copyrighted work. (added pub. l 94-553, Title I, 101, Oct 19, 1976, 90 Stat 2546)
___________________________________
Learning Standards
Massachusetts History and Social Science Curriculum Framework
HISTORY AND GEOGRAPHY
1. Use map and globe skills learned in prekindergarten to grade five to interpret different
kinds of projections, as well as topographic, landform, political, population, and climate
maps. (G)
2. Use geographic terms correctly, such as delta, glacier, location, settlement, region,
natural resource, human resource, mountain, hill, plain, plateau, river, island, isthmus,
peninsula, erosion, climate, drought, monsoon, hurricane, ocean and wind currents,
tropics, rain forest, tundra, desert, continent, region, country, nation, and urbanization.
(G)
3. Interpret geographic information from a graph or chart and construct a graph or chart
that conveys geographic information (e.g., about rainfall, temperature, or population
size data). (G)
Pancreas
Pancreas has two major jobs: Digestion, and hormonal control of blood sugar levels
I. Releases pancreatic juice
• released into the duodenum (first part of the small intestine)
• is alkaline (the opposite of acid).
This neutralizes the acid that had been created by your stomach.
• contains lipases – enzymes which break down fats
• contains proteases – enzymes which break down proteins
• contains amylases – enzymes which break down carbohydrates

II. Pancreas’s endocrine cells release hormones
Hormones regulate your blood sugar levels.
When [blood sugar] too high -> pancreas releases insulin
causes muscle and fat cells to take in more sugar, so this decreases [blood sugar]
promotes glycolysis – conversion of sugar into ATP, also decreases [blood sugar]
makes liver store glucose as glycogen

When [blood sugar] too low -> pancreas releases glucagon
tells liver to break down glycogen into glucose, so this increases [blood sugar]
stops cells taking in more sugar, so this increases [blood sugar]
STOPS glycolysis, so sugar isn’t turned into ATP, so this increases [blood sugar]

from dynamicscience.com.au, feedbackloops
…
Organic molecules in smoke
Burning wood produces a wide array of organic compounds. Each type of wood makes many unique compounds, and the specific compounds formed depend on the amount of oxygen available. Here are a few of them.
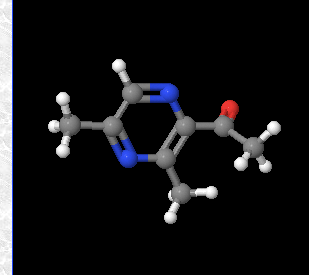
Description: nutty roasted hazelnut
—-
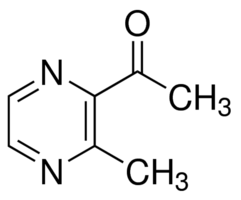
nutty nut flesh roasted hazelnut toasted grain
sigmaaldrich.com
Learning Standards
2016 Massachusetts Science and Technology/Engineering Curriculum Framework
HS-LS1-6. Construct an explanation based on evidence that organic molecules are primarily composed of six elements, where carbon, hydrogen, and oxygen atoms may combine with nitrogen, sulfur, and phosphorus to form monomers that can further combine to form large carbon-based macromolecules.
