Home » Articles posted by New England Blogger (Page 49)
Author Archives: New England Blogger
AI assignment
On a separate sheet of paper please answer these questions (or fill in the blanks)
AI – readings
1. AI is intelligence exhibited by machines. It doesn’t mean that ____________ .
2. What does it mean for a computer to be intelligent?
3. People can do more than solve problems: we are aware, sentient, sapient, and conscious. What does it mean for someone to be sapient?
4. What does it mean for someone to be sentient?
5. Some AI problems have successfully been solved. People are so used to them that we often don’t even call them AI. You may already be using some AIs in your own life. List & clearly describe two examples of these AIs.
6. There is a field of computer science called “philosophy of artificial intelligence.” List 2 of the questions that field is working to answer.
7. How are strong and weak AIs different?
8. In our resource, look at the 2 articles we link to “How to Help Self-Driving Cars Make Ethical Decisions”, or “What Will It Take to Build a Virtuous AI?” Summarize the first article, in your own words, in 3 well-written paragraphs. Summarize the second article for homework.
Chicken or the egg
Which came first, the chicken or the egg?
At first glance, this seems like a reasonable question. But most questions have hidden assumptions. As it turns out, the question itself has a hidden assumption which has to be understood:
The question assumes that
(a) chickens and eggs have existed continuously, without change, for a long period of time
and (b) that chickens lay eggs (but what specifically is an “egg”?)
and (c) that eggs hatch into chickens.
Problem? These assumptions only appear to be true because people only look at chickens and eggs over a short period of time (thinking back over the last 5000 years.)
Yet birds and their ancestors have been continuously changing for millions of years – and so has the way that their ancestors reproduced.
The first chickens… may not even have been chickens, but rather some other form of bird that no longer exists.
And those earlier birds are descendants of a branch of the dinosaur family tree; and those early dinosaurs are a branch of the reptile family tree.
And over very long, deep periods of time, the way that these organisms reproduced has changed!
In fact, the first eggs developed millions of years before anything we even know as birds existed.

Also see:

Evolution of bird eggs, Image by D Anduza
FIGURE 7. Simplified phylogeny showing hypothesized stages in the evolution of reproductive traits toward modern birds.
Exact locations of stages 1 and 4 are unclear, given the complex distribution of traits in basal theropods and the lack of information for basal Aves and Ornithuromorpha.
Synapomorphies: Stage 1, pre-maniraptoran theropods—bilaminar eggshell with a mammillary and second layer composed of narrow shell units, irregularly distributed squamatic.
Stage 2, oviraptor-grade maniraptorans – increase in relative egg size, more elongate egg shape, slight asymmetry, monoautochronic ovulation, iterative laying, eggshell with more pronounced continuous layer and well-developed squamatic ultrastructure, prominent surface ornamentation, large and highly organized clutches, incubation involving nearly full burial with attendant adult, possibly paternal care.
Stage 3, troodontidgrade paravians—loss of surface ornamentation, increasing asymmetry, low porosity, potential for third (external) layer in eggshell, clutches of ‘‘planted’’ and near vertical eggs, improved contact incubation with tighter clutch configuration, and exposed upper portions of eggs.
Stage 4, Enantiornithes—loss of function in right ovary and oviduct, increasing relative egg size, reduction in egg elongation, incubation as in troodontids or as singleton eggs fully buried in sandstone.
Stage 5, basal Neornithes—eggs show further increase in relative size, more variable and less elongate egg shape, clutch free of sediment cover, egg rotation, chalazae with potentially greater incubation efficiency.
Source: Reproduction in Mesozoic birds and evolution of the modern avian
reproductive mode. Authors – David J. Varricchio and Frankie D. Jackson
The Auk: Ornithological Advances Volume 133 p.654–684, 2016 American Ornithologists’ Union
Vapor cones and mach cones
A vapor cone, also known as shock collar or shock egg, is a visible cloud of condensed water which can sometimes form around an object moving at high speed through moist air, for example an aircraft flying at transonic speeds.

When the localized air pressure around the object drops, so does the air temperature. If the temperature drops below the saturation temperature a cloud forms.

In the case of aircraft, the cloud is caused by supersonic expansion fans decreasing the air pressure, density and temperature below the dew point. Then pressure, density and temperature suddenly increase across the stern shock wave associated with a return to subsonic flow behind the aircraft. Since the local Mach number is not uniform over the aircraft, parts of the aircraft may be supersonic while others remain subsonic — a flight regime called transonic flight.
A vapor cone is caused by the formation of so-called ‘Prandtl–Meyer’ expansion fans, which temporarily decrease the air pressure, density and temperature below the air’s dew point. It is not the same thing as the Mach Cone (which is an invisible pressure front), but the two often occur in tandem, allowing us to pretend that we have just seen the sound barrier broken. In this incredible clip of a Boeing F/A-18 Hornet flying at a height of 25 feet, you can see both the Vapor Cone and evidence of the Mach Cone on the surface of the water…
http://physicsfootnotes.com/vapor-cone-versus-mach-cone/
Genetic variation, classification and race
Genetic variation, classification and ‘race’
Lynn B Jorde & Stephen P Wooding
Department of Human Genetics, University of Utah School of Medicine, Salt Lake City, Utah 84112, USA
Nature Genetics 36, S28 – S33 (2004) Published online: ; | doi:10.1038/ng1435
New genetic data has enabled scientists to re-examine the relationship between human genetic variation and ‘race’. We review the results of genetic analyses that show that human genetic variation is geographically structured, in accord with historical patterns of gene flow and genetic drift.
Analysis of many loci now yields reasonably accurate estimates of genetic similarity among individuals, rather than populations. Clustering of individuals is correlated with geographic origin or ancestry. These clusters are also correlated with some traditional concepts of race, but the correlations are imperfect because genetic variation tends to be distributed in a continuous, overlapping fashion among populations. Therefore, ancestry, or even race, may in some cases prove useful in the biomedical setting, but direct assessment of disease-related genetic variation will ultimately yield more accurate and beneficial information.
Figure 1: A neighbor-joining network of population similarities, based on the frequencies of 100 Alu insertion polymorphisms.
The network is rooted using a hypothetical ancestral group that lacks the Alu insertions at each locus. Bootstrap values are shown (as percentages) for main internal branches. (Because of the relatively small sample sizes of some individual populations, bootstrap values for terminal branches within main groups are usually smaller than those of the main branches, indicating less statistical support for terminal branches.)
The population groups and their sample sizes are as follows:
Africans (152): Alur, 12; Biaka Pygmy, 5; Hema, 18; Coriell Mbuti Pygmy, 5; a second sample of Mbuti Pygmy from the Democratic Republic of the Congo, 33; Nande, 17; Nguni, 14; Sotho/Tswana, 22; Kung (San), 15; Tsonga, 14. East Asians (61):
Cambodian, 12; Chinese, 17; Japanese, 17; Malay, 6; Vietnamese, 9. Europeans (118): northern Europeans, 68; French, 20; Poles, 10; Finns, 20. South Indians (365): upper caste Brahmin, Kshatriya and Vysya, 81; middle caste Kapu and Yadava, 111; lower caste Relli, Mala and Madiga, 74; tribal Irula, Khonda Dora, Maria Gond and Santal, 99.

Figure 2
A neighbor-joining tree of individual similarities, based on 60 STR polymorphisms, 100 Alu insertion polymorphisms, and 30 restriction site polymorphisms.
The percentage of shared alleles was calculated for all possible pairs of individuals, and a neighbor-joining tree was formulated using the PHYLIP software package. African individuals are shown in blue, European individuals in green and Asian individuals in orange.

Figure 3
(a) Results of applying the structure program to 100 Alu insertion polymorphisms typed in 107 sub-Saharan Africans, 67 East Asians and 81 Europeans. Individuals are shown as dots in the diagram.
Three clusters appear in this diagram; a cluster membership posterior probability of 100% would place an individual at an extreme corner of the diagram.
(b) A second application of the structure program, using the individuals shown in a as well as 263 members of caste populations from South India. Adapted from ref. 32.

Figure 4
A neighbor-joining tree formulated using the same methods as in Figure 2, based on polymorphisms in the 14.4-kb gene AGT.
A total of 246 sequence variants, including 100 singletons, were observed. The 368 European, Asian and African individuals are described further in ref. 54.

Author’s conclusion: “Race remains an inflammatory issue, both socially and scientifically. Fortunately, modern human genetics can deliver the salutary message that human populations share most of their genetic variation and that there is no scientific support for the concept that human populations are discrete, nonoverlapping entities.
Furthermore, by offering the means to assess disease-related variation at the individual level, new genetic technologies may eventually render race largely irrelevant in the clinical setting. Thus, genetics can and should be an important tool in helping to both illuminate and defuse the race issue.”
______________________________________________
Note by RK about -> ” there is no scientific support for the concept that human populations are discrete, nonoverlapping entities.”
– Outside of racist groups, no scientist even makes such a claim. This article does not debunk the idea that biological groups for humans exists: It clearly shows that such groups exist, in precise detail. However, this data debunk claims made from people using non-scientific definitions of words.
When scientists use words like “race”, “population” or “clade”, these words need to have precise meanings. Every discovery in biology and evolution over the last 200 years shows that biological groups has to exist. That is to say, all life has a family tree that can be represented by cladograms. Those cladograms show evolutionary phylogenies.
“A clade is a grouping that includes a common ancestor and all the descendants (living and extinct) of that ancestor. Using a phylogeny, it is easy to tell if a group of lineages forms a clade. Imagine clipping a single branch off the phylogeny — all of the organisms on that pruned branch make up a clade.”
See Clades and phylogenies and clades rotate = equivalent phylogenies.
Related articles
The Importance of Race and Ethnic Background in Biomedical Research and Clinical Practice
The New England Journal of Medicine, Vol. 348, p. 1170-1175, 2003
Esteban González Burchard, M.D., Elad Ziv, M.D., Natasha Coyle, Ph.D., Scarlett Lin Gomez, Ph.D., Hua Tang, Ph.D., Andrew J. Karter, Ph.D., Joanna L. Mountain, Ph.D., Eliseo J. Pérez-Stable, M.D., Dean Sheppard, M.D., and Neil Risch, Ph.D.
The Genomic Challenge to the Social Construction of Race
By Jiannbin Lee Shiao, Thomas Bode, Amber Beyer et al, Sociological Theory, Vol 30, Issue 2, 2012
Race in biology, genetics and cladistics. Wikipedia.
The Whole Side of It—An Interview with Neil Risch. By Jane Gitschier

Evolution of cereals and grasses
What are cereals and grains, and where do they come from?
A cereal is any grass – yes you read that correctly, grass – cultivated for the edible components of its grain.
Common grasses that produce these wonderful grains are wheat, rye, millet, oat, barley, rice, and corn.

Types of Grains found on Recipematic
Wheat is the most common grain producing grass.

(botanically, a type of fruit called a caryopsis), composed of the endosperm, germ, and bran.
The term may also refer to the resulting grain itself (specifically “cereal grain”).
Cereal grain crops are grown in greater quantities and provide more food energy worldwide than any other type of crop[1] and are therefore staple crops. Edible grains from other plant families, such as buckwheat, quinoa and chia, are referred to as pseudocereals.

From the Health happens at Home website
All of the grains that we eat have been genetically modified by thousands of years of artificial selection. This includes all wheat, barley, rye, spelt and oats.
Paper 1: “Wheat: The Big Picture”, The Bristol Wheat Genomics site, School of Biological Sciences, University of Bristol
Wheat: The Big Picture – the evolution of wheat

Figure 2. Phylogenetic tree showing the evolutionary relationship between some of the major cereal grasses. Brachypodium is a small grass species that is often used in genetic studies because of its small and relatively simple genome.
Paper 2: Increased understanding of the cereal phytase complement for better mineral bio-availability and resource management
Article (PDF Available) in Journal of Cereal Science 59(3) · January 2013 with 244 Reads
DOI: 10.1016/j.jcs.2013.10.003

Fig. 1. Phylogenetic tree of cereals and selected grasses. PAPhy gene copy numbers are given for each species and key evolutionary events are indicated.
Paper 2
Genome-wide characterization of the biggest grass, bamboo, based on 10,608 putative full-length cDNA sequences.
Peng Z, Lu T, Li L, Liu X, Gao Z, Hu T, Yang X, Feng Q, Guan J, Weng Q, Fan D, Zhu C, Lu Y, Han B, Jiang Z – BMC Plant Biol. (2010)
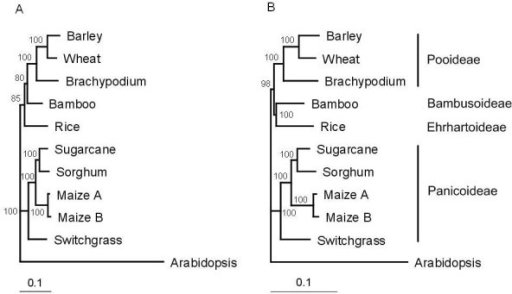
Figure 2: Phylogeny of grasses inferred from concatenated alignment of 43 putative orthologous cDNA sequences. (A) Tree inferred from maximal likelihood method. Bayes inference yielded the same topology. (B) Tree inferred from neighbor joining method. Branch length is proportional to estimated sequence divergence measured by scale bars. Numbers associated with branches are bootstrap percentages. Arabidopsis was used as outgroup. Subfamily affiliation of the grasses is indicated at right.
Paper 3 Evolution of corn

Figure 1: The evolutionary stages of domestication and diversification.
From Evolution of crop species: genetics of domestication and diversification, Rachel S. Meyer & Michael D. Purugganan, Nature Reviews Genetics 14, 840–852 (2013) doi:10.1038/nrg3605
http://www.nature.com/nrg/journal/v14/n12/fig_tab/nrg3605_F1.html
Paper 4 text
Brachypodium distachyon: making hay with a wild grass, Magdalena Opanowicz, Philippe Vain, John Draper, David Parker, John H. Doonan
DOI: http://dx.doi.org/10.1016/j.tplants.2008.01.007

This next image is from Setaria viridis as a Model System to Advance Millet Genetics and Genomics.
By Huang, Pu & Shyu, Christine & Coelho, Carla & Cao, Yingying & Brutnell, Thomas. (2016) Frontiers in Plant Science. 7. 10.3389/fpls.2016.01781.

.
Sonar and ultrasound
Sonar (SOund Navigation And Ranging)
The use of sound to navigate, communicate with, or detect objects – on or under the surface of the water – such as another vessel.

Active sonar uses a sound transmitter and a receiver.
Active sonar creates a pulse of sound, often called a “ping”, and then listens for reflections (echo) of the pulse.

Several animals developed sonar through evolution by natural selection.
Example: whales

Example: dolphins

Example: bats

Aquaman uses sonar! (Superfriends, 1970s, ABC)
How do we know what the ocean floor looks like?
Figure 6.8: A ship sends out sound waves to create a picture of the seafloor below it.
The echo sounder has many beams of sound. It creates a three dimensional map of the seafloor beneath the ship.
Early echo sounders had only a single beam and only created a line of depth measurements.

Boston Harbor

Data from USGS Construction of Digital Bathymetry for the Gulf of Maine
What would it look like if we could use sonar to map out the entire Atlantic ocean?

National Oceanic and Atmospheric Administration (NOAA), ETOPO1 Global Relief Model, http://www.virginiaplaces.org/geology/rocksdui4.html
Ultrasound
Medical ultrasound – a diagnostic imaging technique using ultrasound.
Used to see internal body structures such as tendons, muscles, joints, vessels and internal organs.
The practice of examining pregnant women using ultrasound is called obstetric ultrasound.
Ultrasound is sound waves with frequencies which are higher than those audible to humans (>20,000 Hz).
Ultrasonic images also known as sonograms are made by sending pulses of ultrasound into tissue using a probe.
The sound echoes off the tissue; with different tissues reflecting varying degrees of sound. These echoes are recorded and displayed as an image to the operator.
Medical ultrasound (Wikipedia)

“Amniocentesis is a prenatal test in which a small amount of amniotic fluid is removed from the sac surrounding the fetus for testing. The sample of amniotic fluid (less than one ounce) is removed through a fine needle inserted into the uterus through the abdomen, under ultrasound guidance.”
“The fluid is then sent to a laboratory for analysis. Different tests can be performed on a sample of amniotic fluid, depending on the genetic risk and indication for the test.”

.
Doppler effect
The Doppler effect
Named after Austrian physicist Christian Doppler who proposed it in 1842.
You hear the high pitch of an approaching ambulance’s siren – and then notice that its pitch drops as it passes you. That’s the Doppler effect.
Listen to the Doppler effect! A passing car beeps its horn
Doppler effect Acela express train
The Big Bang Theory – The Doppler Effect
Doppler effect YouTube example 1
Doppler effect YouTube example 2
sound frequency increases during the approach,
is identical as it passes by,
and decreases during the recession.
(Adapted from Wikipedia.)
Watch the spacing of the sound waves, when the car is at rest, and when it is in motion. How does motion change the spacing of the waves?
http://www.acs.psu.edu/drussell/Demos/doppler/doppler.html

Step 1: Staying at rest
In the center is a stationary sound source.
It produces sound waves.
The wavefronts propagate symmetrically away from the source,
at a constant speed

Step 2: Now the source is moving quickly.
Since the source is moving, the centre of each new wavefront
is slightly displaced to the right.
As a result, the wave-fronts begin to bunch up in front of,
and spread further apart behind, the source.
So an observer in front of the source will hear a higher frequency.

We can see this in water: Doppler effect of water flow around a swan

Doppler effect applet
Doppler applet (with sound)
Doppler effect and sonic booms
MCAS problems
By the end of our unit on waves we should be able to do MCAS Physics exam: sample wave problems
Learning Standards
2016 Massachusetts Science and Technology/Engineering Curriculum Framework
HS-PS4-1. Use mathematical representations to support a claim regarding relationships among the frequency, wavelength, and speed of waves traveling within various media. Recognize that electromagnetic waves can travel through empty space (without a medium) as compared to mechanical waves that require a medium
SAT subject test in Physics: Waves and optics
• General wave properties, such as wave speed, frequency, wavelength, superposition, standing wave diffraction, and Doppler effect
• Reflection and refraction, such as Snell’s law and changes in wavelength and speed
• Ray optics, such as image formation using pinholes, mirrors, and lenses
• Physical optics, such as single-slit diffraction, double-slit interference, polarization, and color
Code.Org lessons
Hit the ground running: Coding lessons from Code.Org
We’re using Blockly, a visual coding language.

What are “conditionals”? “On One Condition” If-then-else conditional flowchart lesson
Course 2. Stage 3: Angry Birds coding the path through the maze.
Course 2, Stage 7. Artist loops
Course 2, Stage 10. Bee Debugging.
Course 2, Stage 11. Artist debugging.
Course 2, Stage 13. Bee Conditionals.
Course 2, Stage 16. Flappy Birds
Code.org Stage 19 Artist – nested loops
Code.Org: Course 4 Intro to programming
Course 4: Stage 6, Artist variables
Course 4, Stage 7 : Play Lab variables
Course 4, Stage 9. Bee “For” loops, and counters
Course 4, Stage 10. Artist. “For” Loops.
Course 4. Stage 11. Play Lab “For” loops
Course 4. Stage 12. Artist Functions
Homework: Write a paragraph explaining how loops work, how WHILE loops work,
and how DO…WHILE loops work.
Tutorialspoint: Loops and Chapter 8: Loops. Introduction to Programming
Course 4. Stage 14. Artist with parameters
Course 4. Stage 16. Bees – Functions with parameters
Homework: What is a “Hello, World!” program?
Excelwithbusiness.com: Say “Hello, world!”.
How would we tell a computer to write “Hello, World!” in Blockly?
PCAdvisor How to code-with-google-blockly
Course 4, Stage 19: variables super challenge
Homework :Go to TutorialsPoint (link below) Choose “programming environment”.
(1) What’s the purpose of a text editor?
(2) What’s the purpose of a compiler?
(3) What’s the purpose of an interpreter?
Tutorialspoint.com lessons
Course 4. Stage 21. Super Challenge – Functions and Parameters
Course 4. Stage 2. EXTREME CHALLENGE. No rules. No clues. Just the challenge!
Hour of code programs
tba
Resources
Hexadecimal
The hexadecimal numeral system, hex, is a numeral system made up of 16 symbols (base 16).
Your standard numeral system is called decimal (base 10) and uses ten symbols: 0,1,2,3,4,5,6,7,8,9.
Hexadecimal uses the decimal numbers and six extra symbols, from the English alphabet: A, B, C, D, E and F.
Hexadecimal A = decimal 10, and hexadecimal F = decimal 15.
We mostly use the decimal system. This is because humans have ten fingers (ten digits). Computers however, only have on and off, called a binary digit (or bit, for short). A binary number is just a string of zeros and ones: 11011011, for example.
For convenience, engineers working with computers tend to group bits together. In earlier days, such as the 1960’s, they would group 3 bits at a time (much like large decimal numbers are grouped in threes, like the number 123,456,789).
Three bits, each being on or off, can represent the eight numbers from 0 to 7: 000 = 0; 001 = 1; 010 = 2; 011 = 3; 100 = 4; 101 = 5; 110 = 6 and 111 = 7. This is called octal.
As computers got bigger, it was more convenient to group bits by four, instead of three. The additional bit can be either on or off, a 0 or a 1. So this doubles the numbers that the symbol would represent. This is 16 numbers.
Hex = 6 and Decimal = 10, so it is called hexadecimal.
Four bits is called a nibble (sometimes spelled nybble). A nibble is one hexadecimal digit, and is written using a symbol 0-9 or A-F.
Two nibbles is a byte (8 bits). Most computer operations use the byte, or a multiple of the byte (16 bits, 24, 32, 64, etc.).
Hexadecimal makes it easier to write these large binary numbers.
To avoid confusion with decimal, octal or other numbering systems, hexadecimal numbers are sometimes written with a “h” after the number. For example, 63h means 63 hexadecimal. Software developers quite often use 0x before the number (0x63).
Adapted from https://simple.wikipedia.org/wiki/Hexadecimal_numeral_system
How to Convert from Decimal to Hexadecimal: WikiHow
Light pollution

Source: http://www.pbs.org/seeinginthedark/astronomy-topics/light-pollution.html
This is what we see on a night without clouds, if there was no light pollution:

Some camera lens filters can filter out some of the glare.

Enter a caption
from http://photography-on-the.net/forum/showthread.php?t=1063821
Here are the various levels of polluted vs dark skies:

This video from Sunchaser Pictures shows what LA night skies could look like without light pollution.
“An experimental timelapse created for SKYGLOWPROJECT.COM, a crowdfunded quest to explore the effects and dangers of urban light pollution in contrast with some of the most incredible Dark Sky Preserves in North America. Visit the site for more!
Inspired by the “Darkened Cities” stills project by Thierry Cohen, this short film imagines the galaxy over the glowing metropolis of Los Angeles through composited timelapse and star trail astrophotography. Shot by Gavin Heffernan (SunchaserPictures.com) and Harun Mehmedinovic (Bloodhoney.com). SKYGLOW is endorsed by the International Dark Sky Association”
Also see:
____________________________________________
This lesson is from http://darksky.org/light-pollution/
Less than 100 years ago, everyone could look up and see a spectacular starry night sky. Now, millions of children across the globe will never experience the Milky Way where they live.
The increased and widespread use of artificial light at night is not only impairing our view of the universe, it is adversely affecting our environment, our safety, our energy consumption and our health.
What is Light Pollution?
Most of us are familiar with air, water, and land pollution, but did you know that light can also be a pollutant?
The inappropriate or excessive use of artificial light – known as light pollution – can have serious environmental consequences for humans, wildlife, and our climate. Components of light pollution include:
-
Glare – excessive brightness that causes visual discomfort
-
Skyglow – brightening of the night sky over inhabited areas
-
Light trespass – light falling where it is not intended or needed
-
Clutter – bright, confusing and excessive groupings of light sources
Light pollution is a side effect of industrial civilization. Its sources include building exterior and interior lighting, advertising, commercial properties, offices, factories, streetlights, and illuminated sporting venues.
The fact is that much outdoor lighting used at night is inefficient, overly bright, poorly targeted, improperly shielded, and, in many cases, completely unnecessary. This light, and the electricity used to create it, is being wasted by spilling it into the sky, rather than focusing it on to the actual objects and areas that people want illuminated.
How Bad is Light Pollution?
With much of the Earth’s population living under light-polluted skies, over lighting is an international concern. If you live in an urban or suburban area all you have to do to see this type of pollution is go outside at night and look up at the sky.
According to the 2016 groundbreaking “World Atlas of Artificial Night Sky Brightness,” 80 percent of the world’s population lives under skyglow.
In the United States and Europe 99 percent of the public can’t experience a natural night!

If you want to find out how bad light pollution is where you live, use this interactive map created from the”World Atlas” data or the NASA Blue Marble Navigator for a bird’s eye view of the lights in your town. Google Earth users can download an overlay also created from the “World Atlas” data. And don’t forget to check out the Globe at Night interactive light pollution map data created with eight years of data collected by citizen scientists.
Effects of Light Pollution
For three billion years, life on Earth existed in a rhythm of light and dark that was created solely by the illumination of the Sun, Moon and stars. Now, artificial lights overpower the darkness and our cities glow at night, disrupting the natural day-night pattern and shifting the delicate balance of our environment. The negative effects of the loss of this inspirational natural resource might seem intangible. But a growing body of evidence links the brightening night sky directly to measurable negative impacts including
-
Increasing energy consumption
-
Disrupting the ecosystem and wildlife
-
Harming human health
-
Effecting crime and safety
Light pollution affects every citizen. Fortunately, concern about light pollution is rising dramatically. A growing number of scientists, homeowners, environmental groups and civic leaders are taking action to restore the natural night. Each of us can implement practical solutions to combat light pollution locally, nationally and internationally.
You Can Help!
The good news is that light pollution, unlike many other forms of pollution, is reversible and each one of us can make a difference! Just being aware that light pollution is a problem is not enough; the need is for action. You can start by minimizing the light from your own home at night. You can do this by following these simple steps.
-
Learn more. Check out our Light Pollution blog posts
-
Only use lighting when and where it’s needed
-
If safety is concern, install motion detector lights and timers
-
Properly shield all outdoor lights
-
Keep your blinds drawn to keep light inside
-
Become a citizen scientist and helping to measure light pollution
Learn more about Outdoor Lighting Basics
Then spread the word to your family and friends and tell them to pass it on. Many people either don’t know or don’t understand a lot about light pollution and the negative impacts of artificial light at night. By being an ambassador and explaining the issues to others you will help bring awareness to this growing problem and inspire more people to take the necessary steps to protect our natural night sky.
IDA has many valuable resources to help you including Public Outreach Materials, How to Talk to Your Neighbor, Lighting Ordinances and Residential and Business Lighting.
Want to do more? Get Involved Now

